WATCH TO THE END! I PROMISE! IT'S WORTH IT!
This started as a personal fun project just to recreate a Mac calculator look-a-like, but when I added 3D graphing, it became much more, then I added volumetric 3D, then ray tracing, then materials with material accurate refractive indexes, then animation, it became SO MUCH MORE!
Maculator FAQ
A Mac Calculator clone for Linux and Windows, built with Avalonia UI. If you're here, you probably noticed it does a lot more than basic arithmetic.
New User Questions
"Wait, this looks exactly like the Mac Calculator. Is it?"
Maculator is a faithful recreation of the macOS Calculator app, built from scratch for Linux and Windows using .NET and Avalonia UI. It replicates the visual design as closely as possible: the dark theme, the rounded buttons, the traffic-light window controls, and the display font. It is not affiliated with Apple.
"Does it have all the Mac Calculator modes?"
Yes. Basic, Scientific, Programmer, and RPN are all present and work the same way as the macOS original. Maculator also adds modes that Apple's calculator doesn't have: unit Conversion, Math Notes (a live expression scratchpad), and a full 3D function graphing engine.
"How do I switch between modes?"
Click the calculator icon in the top-right corner of the title bar. A dropdown menu lists all available modes.
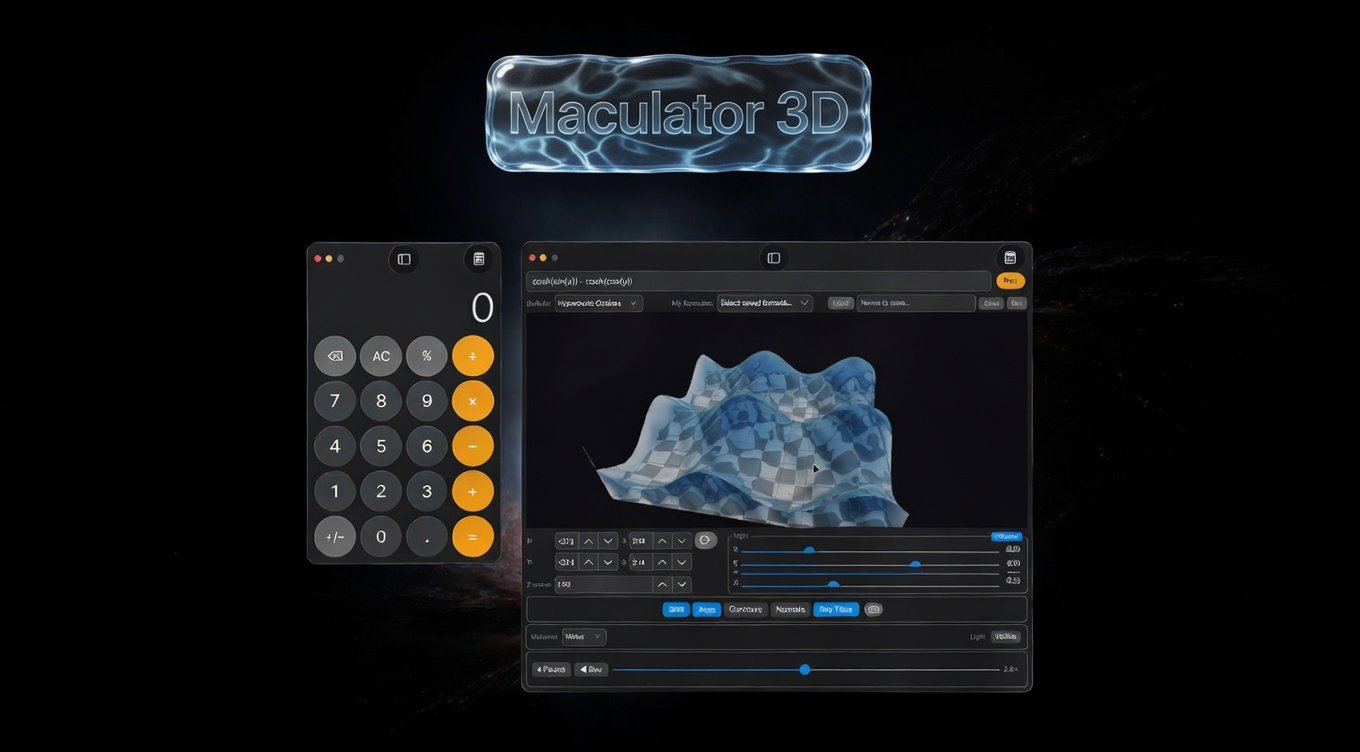
"I found the 3D graphing by accident. What can it do?"
The 3D graph mode plots any function of the form z = f(x, y). Type an expression like sin(x) * cos(y) or x^2 - y^2 and hit Plot. You can:
"What are the built-in formulas?"
Eight presets ship with the app: Sine Wave, Ripple, Saddle, Paraboloid, Cone, Gaussian Bell, Torus Cross-section, and Hyperbolic Cosines. Each one sets the expression, axis ranges, Z-scale, and camera position automatically. Several include animation formulas.
"What does the RT toggle do?"
RT enables real-time Vulkan ray tracing. If your GPU supports the VK_KHR_ray_tracing_pipeline extension (most NVIDIA RTX and AMD RDNA 2+ cards), the surface is rendered with physically accurate reflections, refractions, and volume absorption instead of the standard OpenGL rasterizer. If your GPU doesn't support it, the toggle is grayed out.
"What are the material options (Glass, Water, Metal, etc.)?"
These are physically-based rendering (PBR) materials that change how the surface interacts with light. Each material has real-world optical properties:
Materials only appear when RT mode is active.
"Can I save my own formulas?"
Yes. Type a name in the formula name field and click Save. Your formula, axis ranges, Z-scale, and current camera angle are all saved. Formulas persist across sessions in a JSON file in your user data directory.
"Does the calculator remember my settings?"
Yes. Last-used mode, angle unit (degrees/radians), thousands separator preference, 3D lighting parameters, and user formulas all persist between sessions.
"Is there keyboard support?"
Full keyboard support in all modes. Digits (0-9), operators (+, -, *, /), Enter/= to evaluate, Escape to clear, Backspace to delete, and % for percentage all work as expected.
"Where is the history?"
A history panel slides out from the side of the calculator. It groups calculations by date, lets you click any entry to restore its value, and persists across sessions.
Programmer Questions
"What's the tech stack?"
"How do I build and run it?"
dotnet build                    # Build
dotnet test                     # Run all tests
bash scripts/run.sh             # Run the app
"How does the 3D rendering work?"
Two rendering paths:
"How does the expression parser work?"
Graph3DEngine uses a recursive-descent parser that handles standard math functions (sin, cos, tan, log, exp, sqrt, abs, etc.), operators with correct precedence, parentheses, and the variables x, y, and t. The parser compiles to a delegate for efficient repeated evaluation across the mesh grid.
"How is the mesh generated?"
Graph3DEngine.GenerateMesh() evaluates f(x, y) on an N x N grid (default N=80), producing:
For RT mode, BuildClosedMeshForRt() generates a watertight closed volume by adding side walls and a floor, enabling correct refraction and volume absorption.
"What about performance? Any gotchas?"
Key optimizations in the rendering pipeline:
"How does persistence work?"
PreferencesService serializes a UserPreferences record to JSON in Environment.GetFolderPath(SpecialFolder.ApplicationData)/Maculator/. User formulas are stored separately via FormulaLibraryService in formulas.json at the same location. History is managed by HistoryService.
"Is there a test suite?"
Yes. 173 xUnit tests cover the calculator engines, expression parser, 3D mesh generation, conversion logic, and math notes evaluation. Run them with dotnet test.
"Can I contribute? What's the workflow?"
The project uses GitHub Flow on a private GitLab instance:
Branch naming: feature/issue-N-description or fix/issue-N-description.
"How big is the deliverable?"
"Is there a license?"
No license file is present in the repository at this time.
Scientific Questions
"What math functions does the expression parser support?"
For 3D graphing and Math Notes, the full function set is:
"What coordinate system does the 3D grapher use?"
Cartesian. The surface is z = f(x, y) evaluated over a rectangular domain [XMin, XMax] x [YMin, YMax]. The default domain is [-pi, pi] x [-pi, pi]. Axis ranges are adjustable via numeric inputs. Z-scale provides vertical exaggeration.
"Can I visualize time-dependent surfaces?"
Yes. Use the variable t in your expression. It represents elapsed time in seconds. For example, sin(x + t) * cos(y - t) produces a traveling wave. The Play/Pause button starts animation, and you can control speed (multiplier) and direction (forward/reverse).
Several built-in formulas include animation variants. You can also write a separate animation formula that overrides the static expression during playback.
"How are surface normals computed?"
Per-vertex normals are computed analytically from finite differences of the evaluated function. The normal at grid point (i, j) is the cross product of the tangent vectors in the x and y directions, using central differences where possible and forward/backward differences at boundaries. Normals can be visualized as arrows using the Normals overlay toggle.
"What are the contour lines showing?"
Contour lines are iso-value curves of constant z projected onto the surface. They are computed using a marching-squares algorithm on the evaluated grid. The number and spacing of contour levels is determined automatically from the ZMin/ZMax range of the surface.
"How physically accurate are the PBR materials?"
The index of refraction values are sourced from published references:
The renderer implements Cook-Torrance microfacet BRDF with GGX normal distribution for reflections, and Beer-Lambert volume absorption for transmissive materials (glass, water, honey, ice). Light transport is computed via Vulkan ray tracing hardware acceleration.
"Can I export high-resolution images for publication?"
Yes. The Export button opens a dialog where you can choose:
For a typical viewport of 800x600, a 4x export produces a 3200x2400 image.
"Can I use this for teaching?"
The combination of real-time interaction, animation, contour overlays, normal visualization, and material rendering makes it well-suited for:
The formula library lets you prepare and save demonstrations in advance with preset camera angles.
"What resolution can the mesh go up to?"
The resolution slider goes from 2 to 500 subdivisions per axis. At resolution 500, the mesh has 250,000 vertices and roughly 498,000 triangles. Default is 80 (6,400 vertices). Higher resolutions produce smoother surfaces but take longer to generate and render.
"How does the Math Notes scratchpad work?"
Math Notes evaluates each line as you type. Lines ending with = show their result. You can define variables (x = 5) and use them in subsequent lines (x^2 + 3 = shows 28). All standard math functions and constants are available. Results update dynamically when you change any variable's value, and downstream expressions recompute automatically.
"Is there unit conversion support?"
Yes, in Conversion mode. Eight categories are supported: length (mm through miles), mass (mg through metric tons), time (ms through years), temperature (C, F, K), area, volume, speed, and data storage (bits through terabytes). Two-way conversion with a swap button.